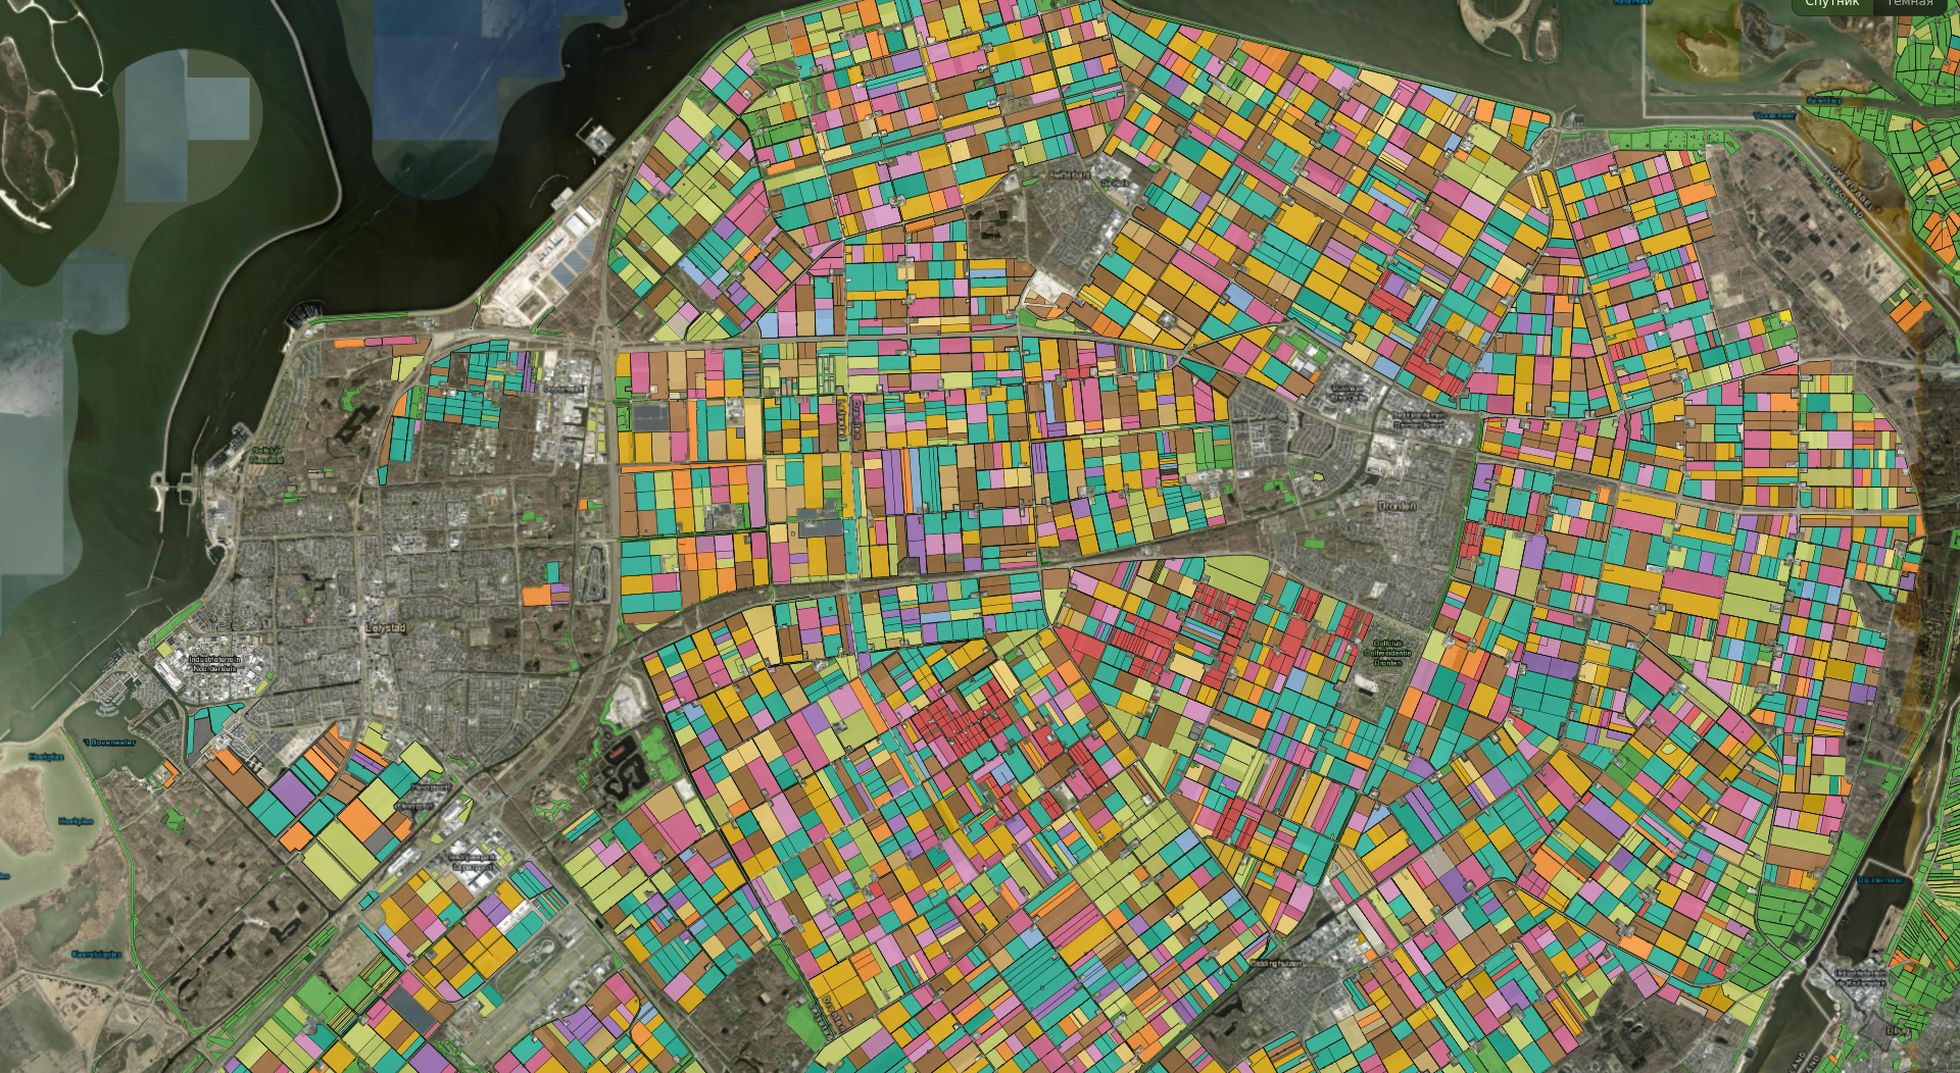
We find the fields
Every parcel drawn straight from satellite — automatically, even where no cadastre exists. Without this map, nothing downstream has anything to attach to.
Live: 69M parcels — including 1.6M in Ukraine, drawn from scratch.
CropMap maps every field and what's growing in it — at national scale, in any country, months before the harvest is in.
Each link only works if the one before it does — which is why most providers stop at the first. We run the whole chain, and we run it while the crop is still in the ground.
Every parcel drawn straight from satellite — automatically, even where no cadastre exists. Without this map, nothing downstream has anything to attach to.
Wheat, maize, rapeseed, sugar beet, barley, rye, flax and more, field by field. Most maps land after harvest; ours read the crop while it is still growing.
Known parcel, known crop, watched all season — the ingredients yield needs. We build yield on top of that chain, scoped to your geography and crop.
We read a full season of satellite signal through geospatial foundation models. That's why a model calibrated on one country still reads the next — where field-data-hungry approaches collapse the moment they cross a border.
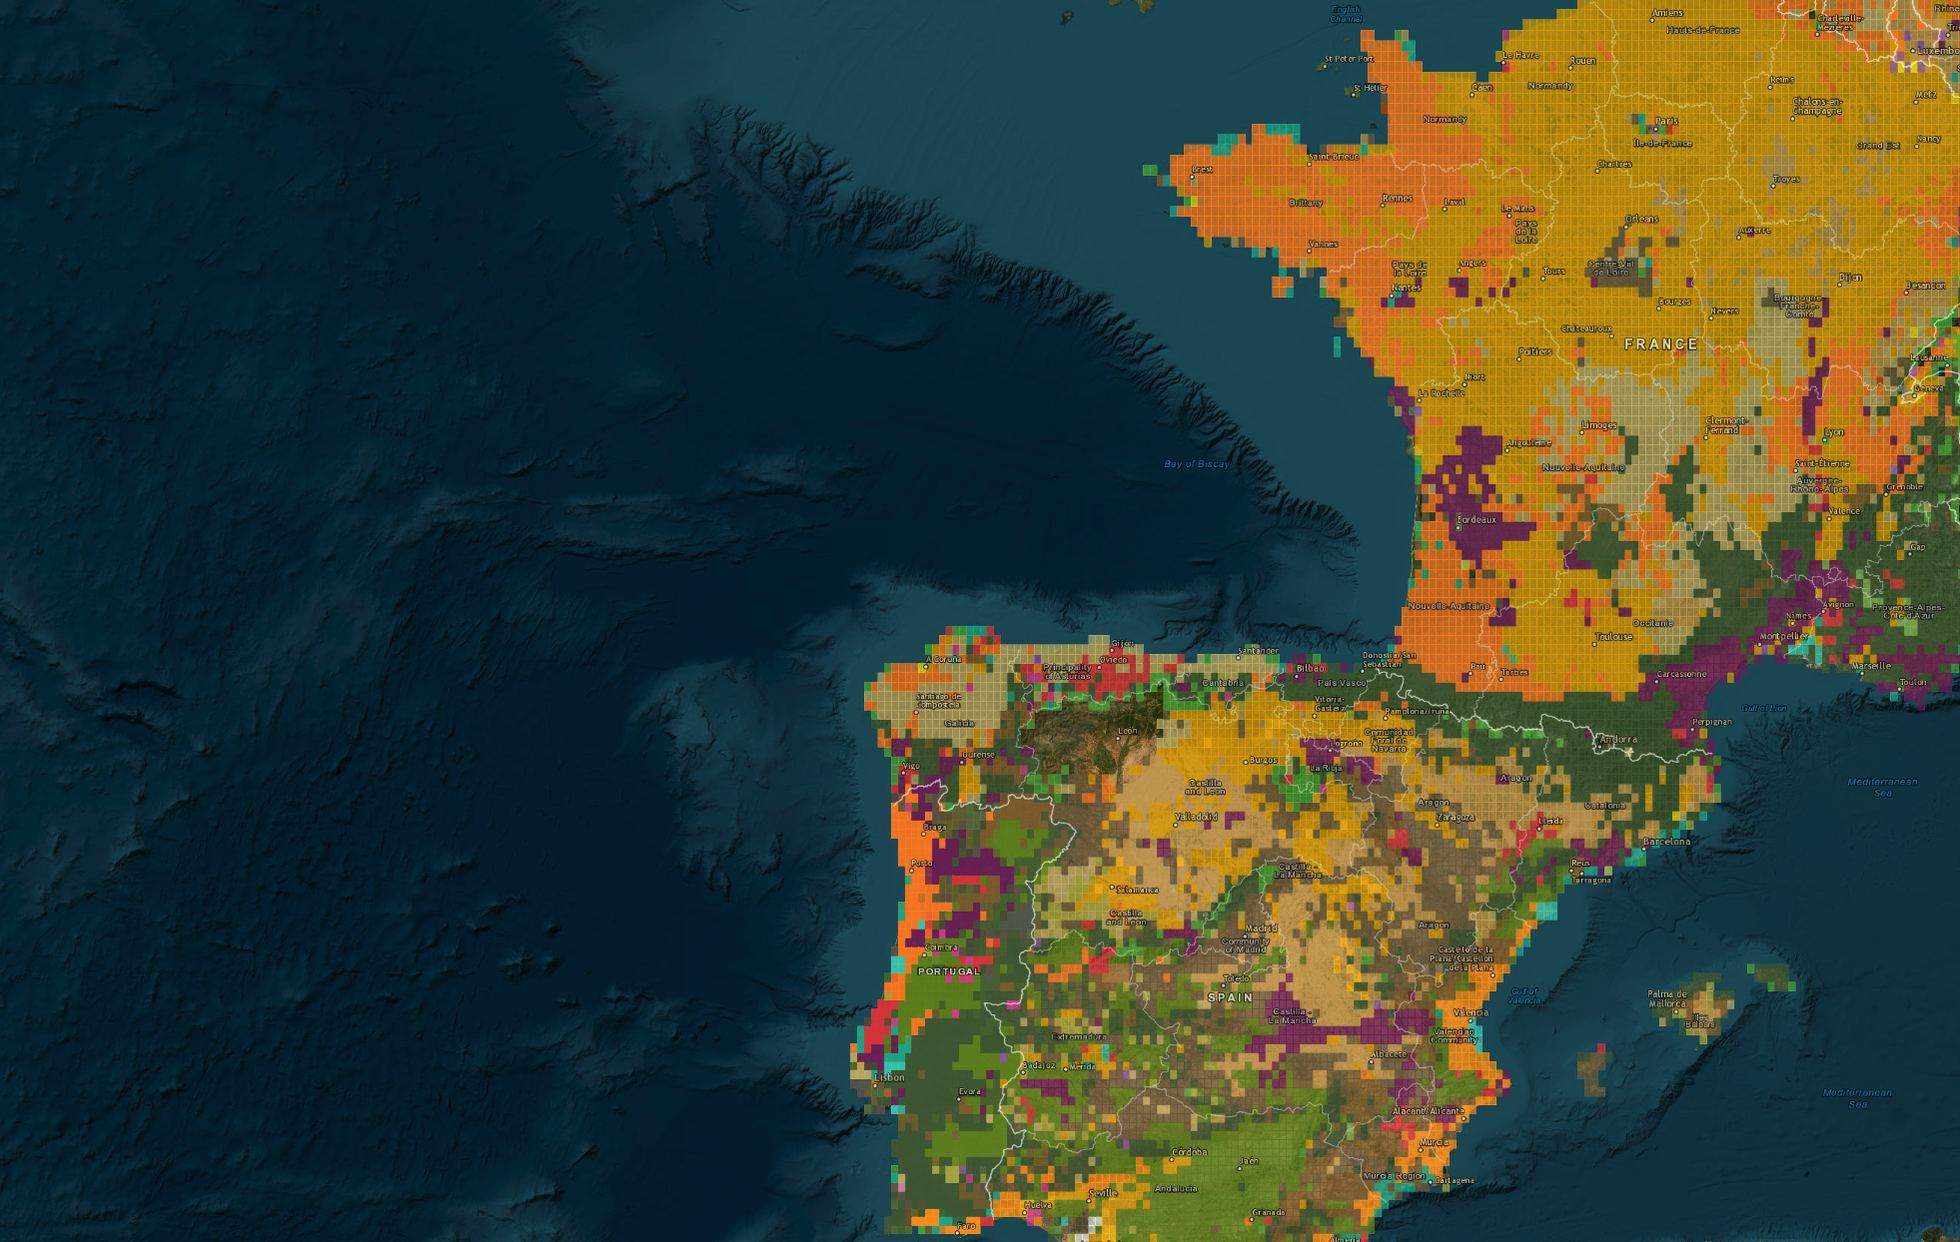 one model · France → Spain → Portugal, no retraining
Early, wall-to-wall production signal — acreage and crop mix before official stats print.
Field-level exposure, planting verification and faster, evidenced claims.
Collateral you can see — what's planted on the parcels behind every loan.
Demand mapped to real crop rotations, region by region.
A ready field-level base layer to build products and traceability on.
Independent, timely crop area estimates — including where declarations are thin.
Not mock-ups — live tiles from our production maps, exactly as they render today.
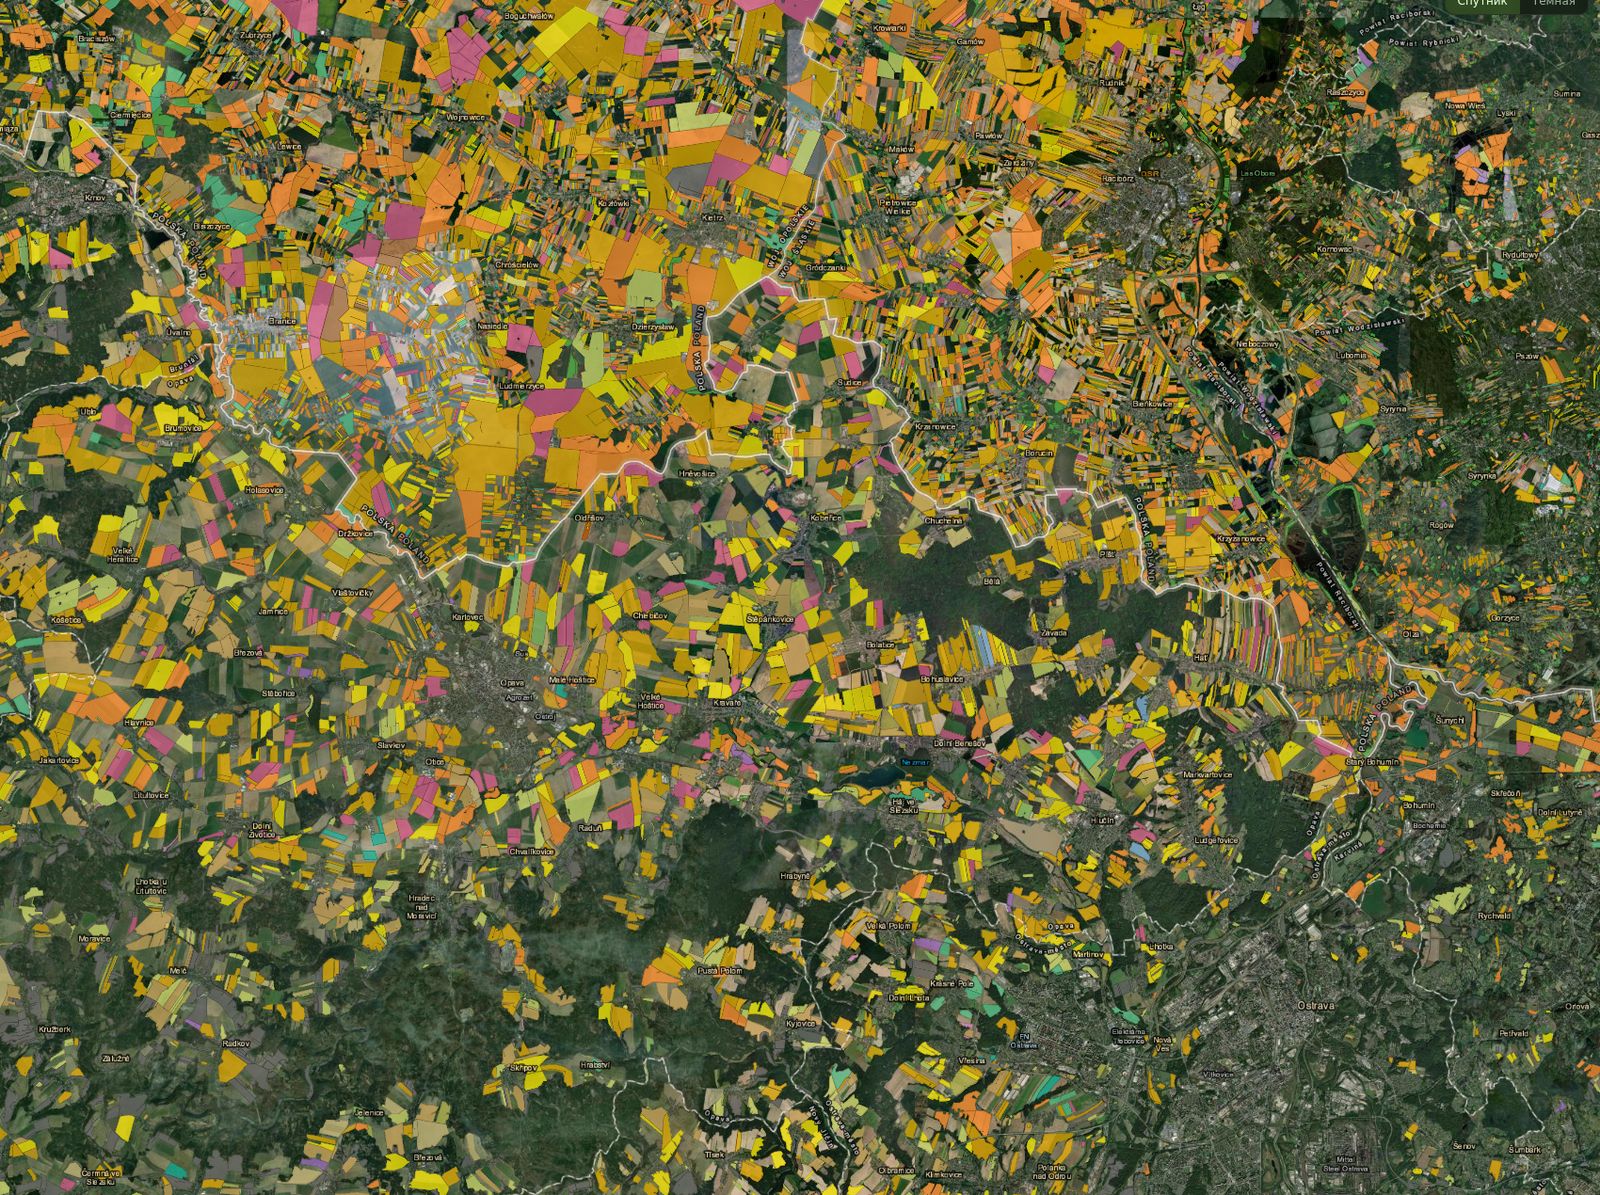
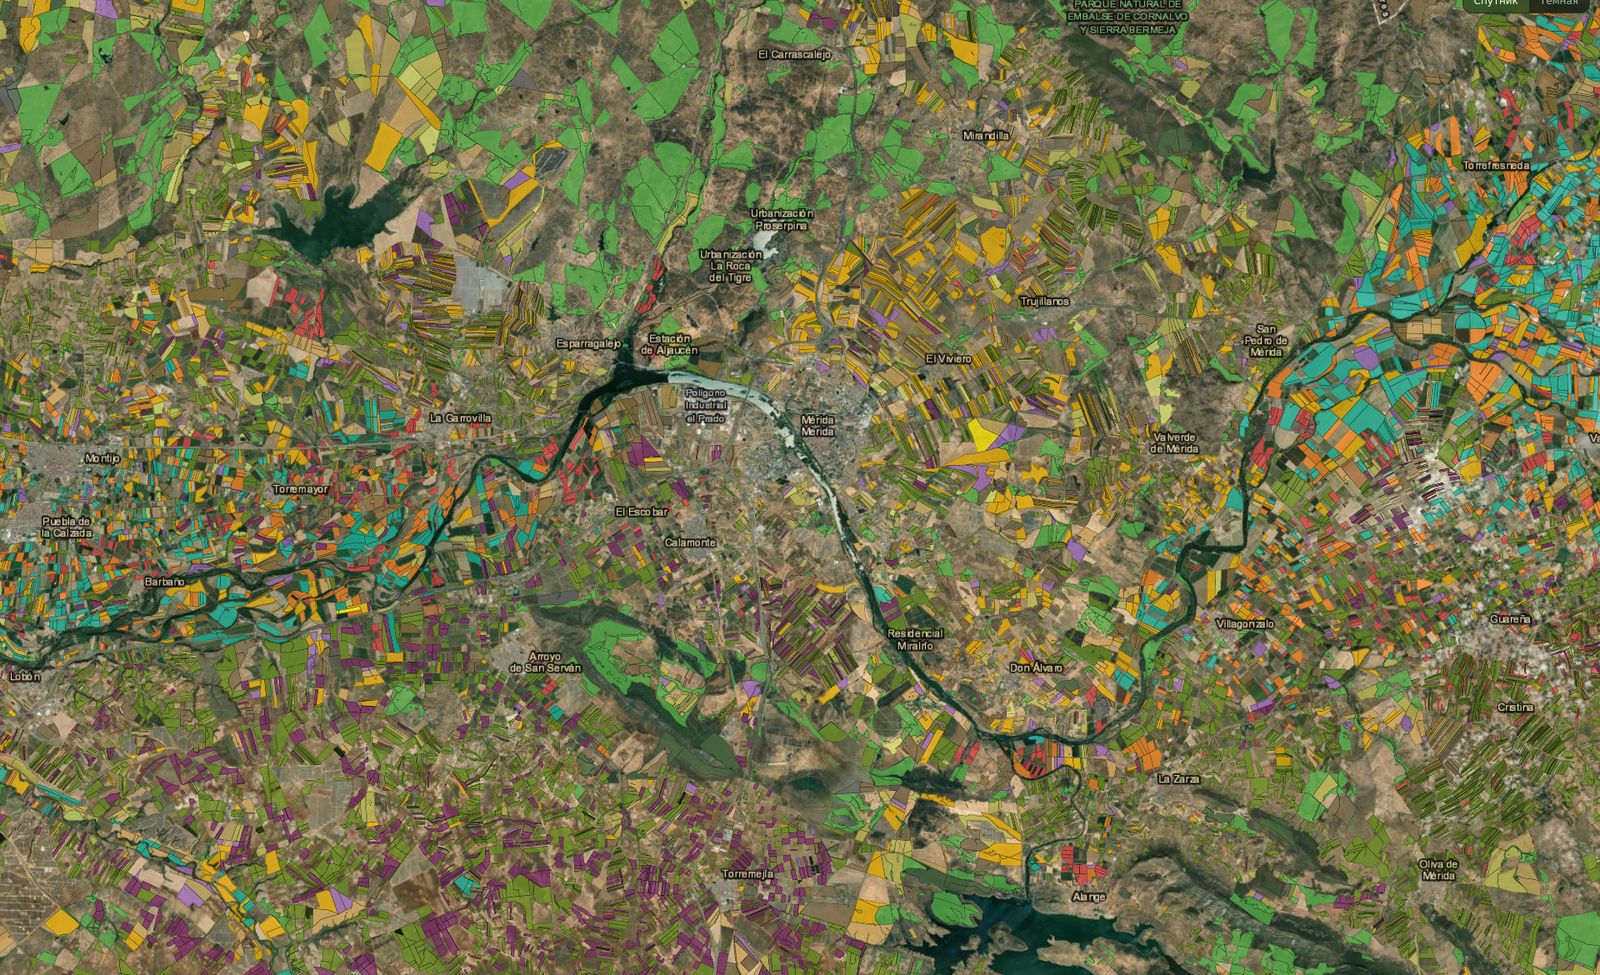
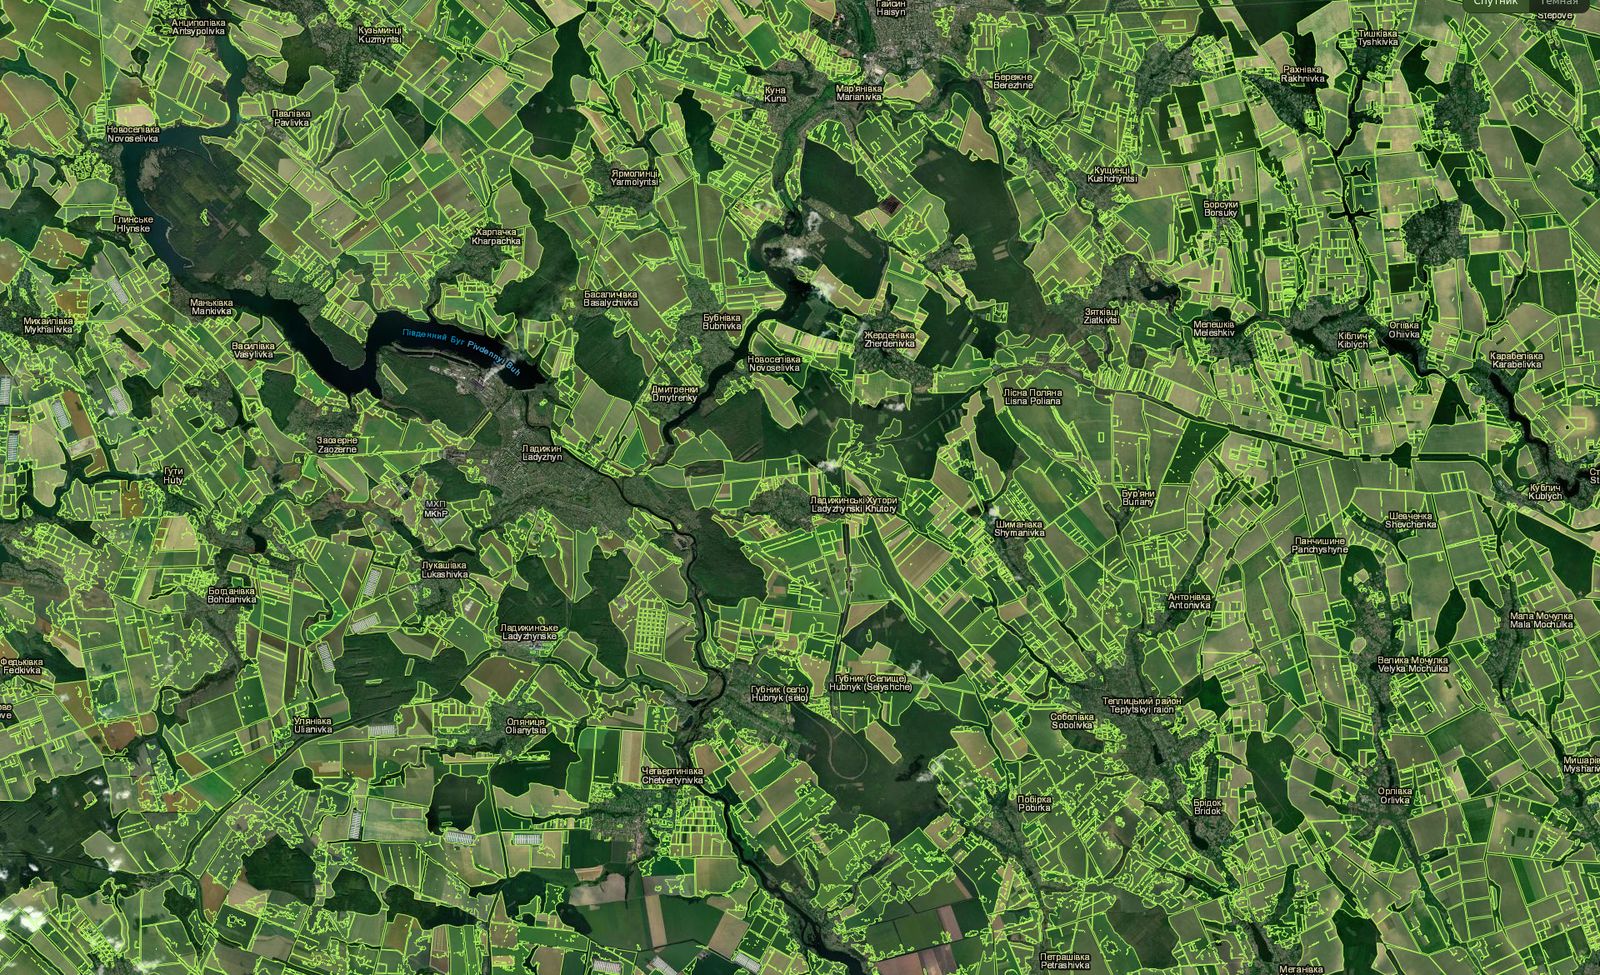
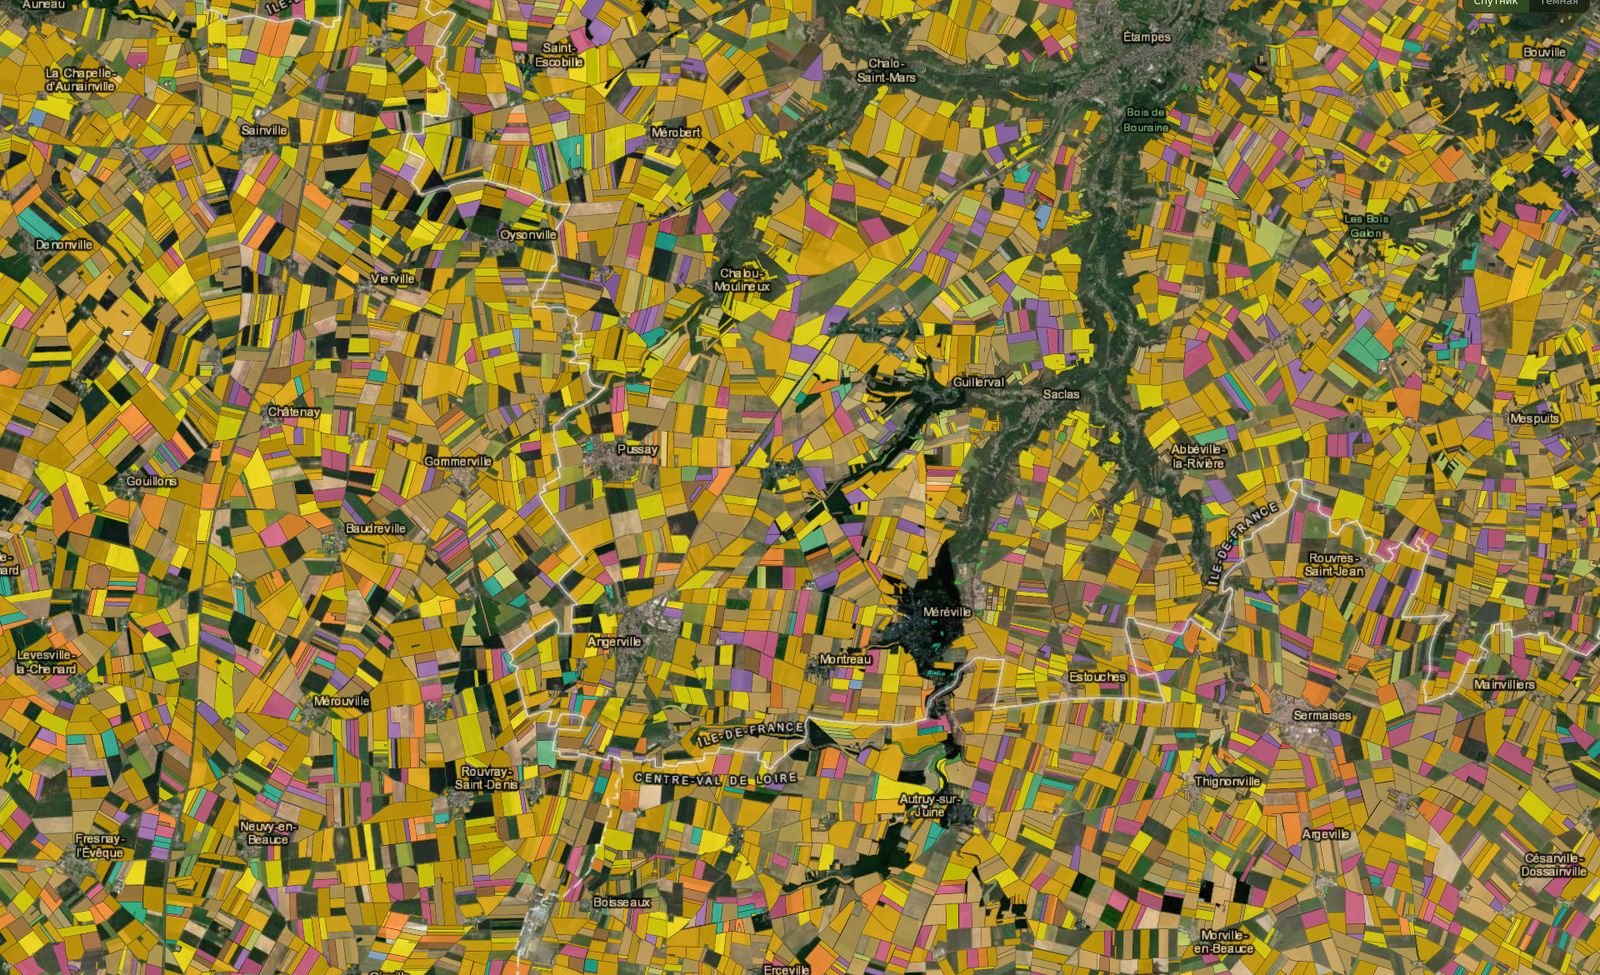
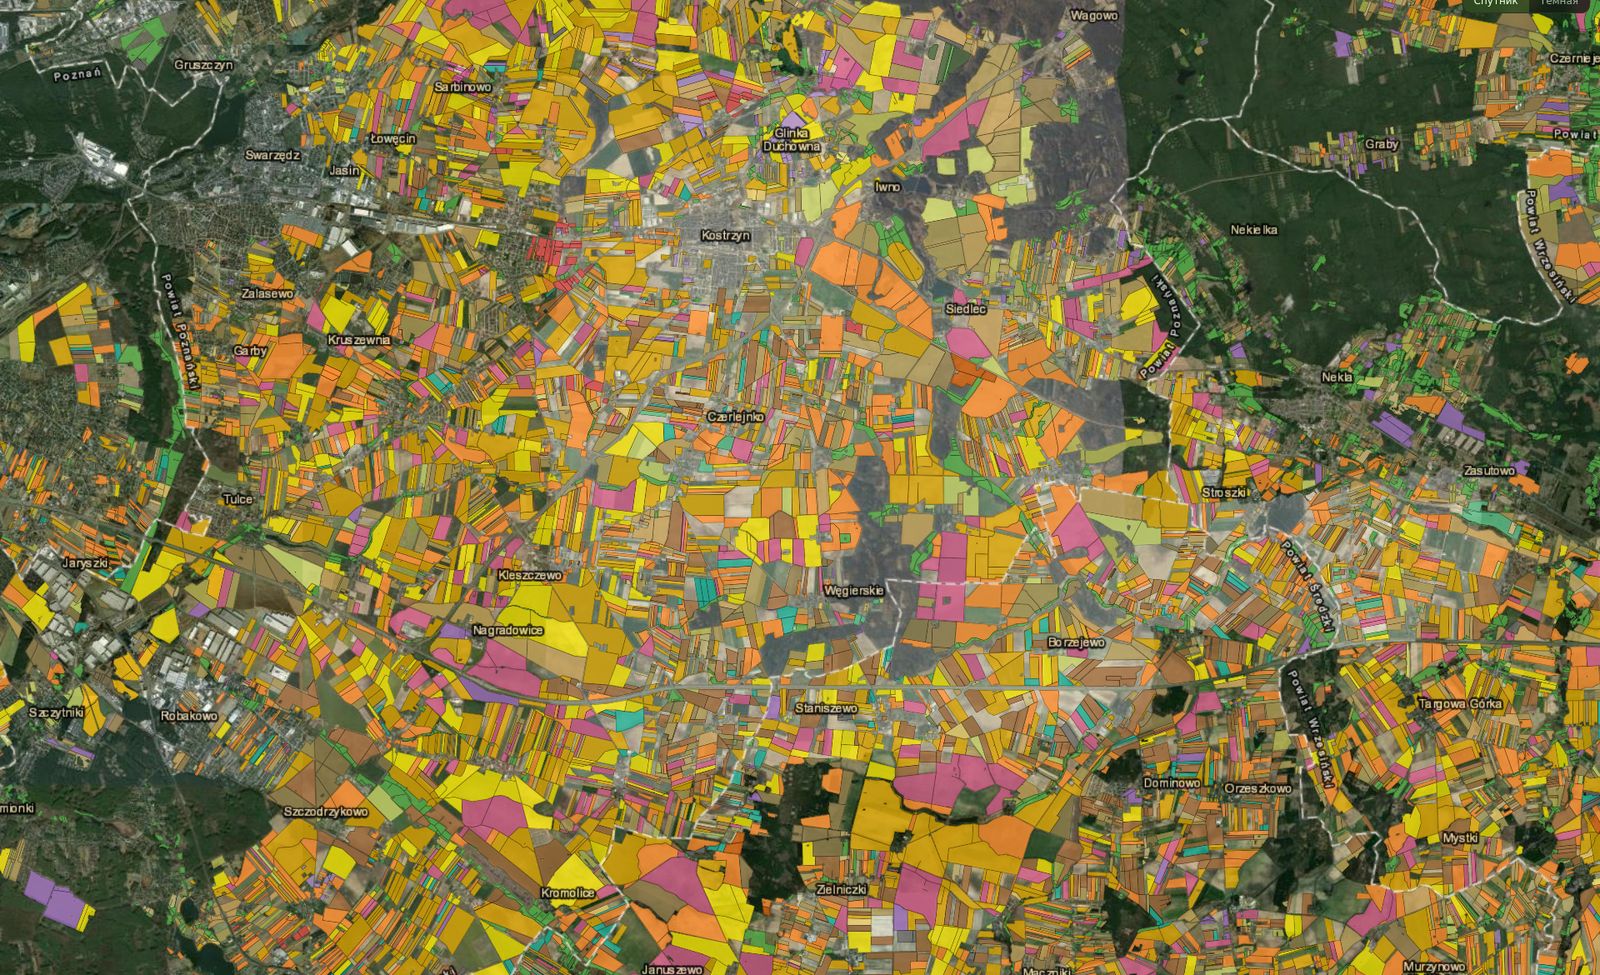
Interactive per-field maps you can pan right now — crops and boundaries, updated as new imagery lands.
Official numbers arrive late, aggregated to a region, and only after the season closes. We deliver the same picture per field and mid-season — months earlier, at a resolution you can act on, in countries where no reliable statistics exist at all.
30+ countries across Europe, plus Ukraine, Kazakhstan and more — 163M hectares live today. If your area of interest isn't on the map yet, we add regions on request; a new country is typically a matter of weeks, not a new product.
Our maps are produced from satellite and validated against ground truth. Accuracy varies by crop, region and how early in the season you ask — winter crops read earlier and cleaner than spring crops. We're happy to share validation figures for your geography and crops before you commit.
No. We detect field boundaries directly from satellite — that's the first link in the chain — so we can start anywhere, with no cadastre and no field visits. If you already have your own parcels, we can classify crops on those instead.
However fits your stack: a REST API, vector tiles for your map, or bulk export (GeoJSON, GeoPackage, Parquet). Crops come in a raw taxonomy and can be grouped to your own classes on delivery.
Yield is the third link in the chain and is currently in pilot. Because we already know the parcel and the crop and watch it all season, we build yield on top of that — scoped to a specific geography and crop. Tell us your region and we'll scope a pilot.
Pricing depends on the geography, how often you need updates, and the delivery format. Request access with your area of interest and we'll come back with a scoped quote — no obligation.
Tell us the geography and the decision. We'll send back a sample map for your region and a short call.
Thanks — we'll pull a sample map for your region and get back to you from hello@cropmap.ai, usually within a day.